
What you ask vs
what you keep.
Between the price a home is listed at and the money its seller banks sit four deductions. We measured them, added them up on one £300,000 home, and found that even a well-run sale returns about 94p in the pound.
Bettermove looked into what home sellers really walk away with. Not the price on the listing, but the money that lands in their account once the sale completes.
Using the latest published figures from Zoopla, Rightmove, the HomeOwners Alliance and others, alongside our own enquiry data, we followed one £300,000 home from listing to completion and counted every pound that falls away along the way. The answer: even a well-run sale keeps about 94p in the pound, and the biggest losses are the ones sellers have the most control over.
Between the price a home is listed at and the money its seller banks sit four deductions: any price cut, the gap between asking and agreed price, the costs of sale, and the cost of time. Three of the four can be measured from published national data. This report measures them, applies them to a single worked ledger, and uses Bettermove enquiry data to show who carries the cost.
The average agreed price is 3.5% below the final asking price (Zoopla, Q1 2026) and the costs of sale take roughly another 2% (HomeOwners Alliance). Neither can be avoided.
See the ledger →One sold home in four needed a price cut first (Rightmove). In our ledger, a single 5% cut removes £14,475 from the agreed price, more than every fee combined.
The starting price →The average sale takes about 214 days from listing to completion (Rightmove). An empty home with a £150,000 mortgage costs its owner about £28 a day while it waits.
The cost of time →One home, three outcomes
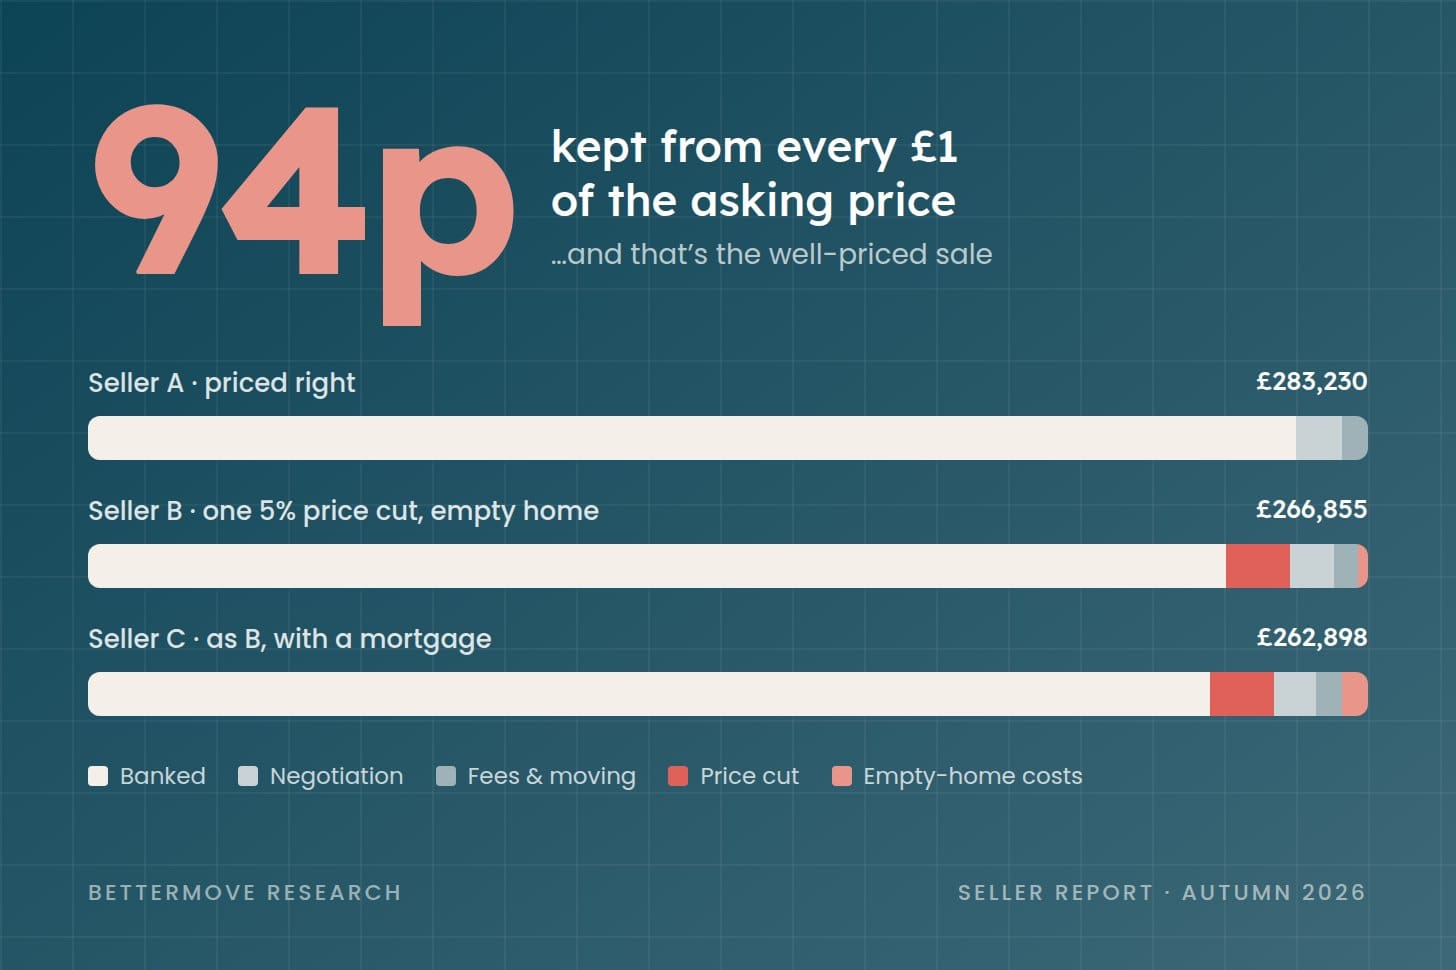
Applying the published averages to a £300,000 asking price, the seller banks between £283,230 and £262,898. The range is set almost entirely by two things: the starting price, and what the home costs while it waits.
The ledger follows one home from listing to completion, applying the published average at each step. It is an illustrative model, not an average of real sales; every assumption is listed in the method section.
The same £300,000 home banks £283,230, £266,855 or £262,898
Red and coral mark the avoidable costs: the price cut and the empty-home wait. Greys are what every sale pays.
| Seller Apriced right, still living there | Seller Bone price cut, moved out, no mortgage | Seller Cas B, with a £150,000 mortgage | |
|---|---|---|---|
| Asking price | £300,000 | £285,000 after a 5% cut | £285,000 after a 5% cut |
| Agreed price (3.5% below asking) | £289,500 | £275,025 | £275,025 |
| Estate agent (1.42% inc. VAT) | −£4,111 | −£3,905 | −£3,905 |
| Legal, EPC and removals | −£2,159 | −£2,159 | −£2,159 |
| Holding costs while waiting | £0 | −£2,105 | −£6,063 |
| In your pocket | £283,230 | £266,855 | £262,898 |
| Share of original asking price | 94.4% | 89.0% | 87.6% |
Sellers A, B and C pay the same professional costs. The £20,332 between A and C comes from decisions made before and during the sale, not from the fees: the 5% cut removes £14,475 from the agreed price, more than the agent, the conveyancer, the EPC and the removal van combined, and the empty home adds a holding cost for every day of the wait.
Where the £14,475 comes from. Seller A’s buyer pays £289,500, which is £300,000 less the usual 3.5%. Seller B’s buyer pays £275,025, which is £285,000 less the same 3.5%. The difference between the two is £14,475. The cut was £15,000 on the asking price, but it costs £14,475 at the agreed price, because the buyer’s 3.5% now comes off a smaller number.
None of these figures include a mortgage early repayment charge, or the cost of a sale falling through. Either can make the gap wider.
The model is deliberately conservative about shocks. Run the same ledger with one fall-through on Seller C, using the Open Property Data Association’s £2,830 average cost and three further months of holding, and the banked figure falls to about £257,500, or roughly 86p in the pound. Replace the single 5% cut with a second one and it falls to about £249,300, or 83p. Neither is an unusual outcome: one agreed sale in four falls through, and in Zoopla’s research more than half of the sellers who sold had cut their price at least once along the way.
What would you keep?
Put in your own asking price and situation. The calculator applies the same published averages as the ledger above, so treat the result as a guide, not a quote.
Uses a 3.5% gap between asking and agreed price (Zoopla), a 1.42% agent fee and £2,159 for legal, EPC and removals (HomeOwners Alliance midpoints), and for empty homes £9.84 a day for council tax and energy (MHCLG, Ofgem). Excludes early repayment charges, fall-throughs, insurance and tax. Not financial advice.
The largest cost a seller controls
What a seller keeps depends more on the price set on day one than on anything else they control.
According to Rightmove, 74% of homes that sold this year never needed a price cut. They were priced right, and they went. The other quarter had to come down first.
For the ones that didn’t sell at all, price is often part of the problem. Zoopla looked at homes put on the market over the last three years and found 44% never sold. A third of those sellers admitted their asking price was too high. Zoopla also found that for every 5% a home is priced above similar homes nearby, its chance of selling drops by about 5%.
Price cuts have been stuck above normal for more than a year. In March 2026, 13.2% of homes for sale had their price reduced. Across 2025 the average was 12.8%, against a six-year average of 10.7%.
So why do so many start too high?
Part of the answer is valuations. In a September 2026 survey by GetAgent of 162 estate agents, 95% said rival agents give unrealistic valuations to win instructions, 67% said the practice is more common than a year ago, and 89% said they had lost a seller in the past year to an agent quoting a higher figure. GetAgent is an agent comparison site and these are self-reported answers, so we treat them as the industry’s account of itself rather than a measurement.
The mechanism is straightforward. Sellers tend to instruct the agent with the highest figure, so an inflated valuation wins listings, and a valuation is not an offer. The consequences then appear in the price-cut data above.
3.5% below asking
Even a well-priced home usually sells for a little under its asking price.
Zoopla says homes agreed in the first three months of 2026 went for 3.5% below the asking price on average. On our £300,000 example, 3.5% is £10,500. That’s before a single fee is paid.
This is normal. Buyers expect to negotiate, and asking prices leave room for it. The problem is when the discount lands on top of a price cut that’s already happened, because the two add up. Seller B and Seller C in our example lost £15,000 to the cut and then almost £10,000 more to the negotiation.
A note on bigger numbers. You may have seen claims this year that sellers are accepting drops of more than 20% between their first asking price and the final sale. We’ve looked at those figures and don’t think they compare like with like, so we haven’t used them. Zoopla’s 3.5% compares the asking price with the price actually agreed.
About 2%, and fixed
Fees and moving costs take around 2% of the sale price on a typical home, and they’re the same whether you priced it right or not.
| Cost | Typical amount | On our £300,000 example |
|---|---|---|
| Estate agent | 1.42% of the sale price, including VAT | £3,905 to £4,111 |
| Conveyancing (selling) | £610 to £950 | £780 |
| Energy Performance Certificate | £60 to £120 | £90 |
| Removals | £334 to £2,243 | £1,289 |
| Leasehold management pack (if leasehold) | £300 to £800 | Not included |
| Mortgage early repayment charge | Depends on your deal | Not included |
These are averages from the HomeOwners Alliance. Your own costs could be higher or lower. London agents often charge more, and a big house moving a long way costs more to move.
The one to check is the early repayment charge. If you’re still in a fixed deal, it can run into thousands on its own. Ask your lender before you set your price, not after.
214 days, and a daily price for empty homes
The average sale takes about 214 days from listing to completion. For an empty home, that time has a daily price.
Rightmove’s September 2026 figures put the average at 64 days to find a buyer, then roughly 150 more from sale agreed to completion: about 214 days, a little over seven months, from listing to keys.
Source: Rightmove, September 2026.
And the clock can restart. One in four agreed sales falls through before completion, according to portal data analysed by Watkin Property Ventures. When that happens, the people involved lose around £2,830 and about three months each time, according to the Open Property Data Association.
When waiting costs you
If you still live in the home, you’d pay the mortgage and bills anyway, so waiting doesn’t add much in cash. The real risk for you is losing the home you’re trying to buy.
It’s different if the home is empty. That’s often the case if you’ve inherited it, already moved for work, or you’re a landlord between tenants. Then you’re paying for a home nobody lives in.
| Cost of an empty home | Per year | Per day | Over 214 days |
|---|---|---|---|
| Council tax (average per home, England) | £1,868 | £5.12 | £1,095 |
| Energy (typical bill, October 2026 price cap) | £1,723 | £4.72 | £1,010 |
| Total, no mortgage | £3,591 | £9.84 | £2,105 |
| Mortgage interest on £150,000 at 4.5% | £6,750 | £18.49 | £3,958 |
| Total, with mortgage | £10,341 | £28.33 | £6,063 |
That’s on top of insurance, which usually costs more for an empty home, and any repairs. And if an inherited home stays empty long enough, many councils can add an empty homes premium to the council tax bill.
Energy use in an empty home will usually be lower than a typical bill, so treat that line as an upper limit.
What our enquiry data shows
The sellers hit hardest by the gap are the ones who can least afford to wait: people with an empty home.
Most of the people who contact us say why they are selling. Between January and August 2026, roughly a quarter of the reasons people gave us related to an inherited home, a second home or a buy-to-let. When homes like these sit empty on the market, the daily costs in section 4 apply in full.
Most of the gap is avoidable
The fees are fixed. The price cut and the wait usually aren’t.
Asking prices are hopes. Sold prices are facts. Look up homes like yours nearby that completed in the last six months.
Ask each agent to show you the sold prices behind their figure, how close to the asking price their sales actually go, and how long they take. In the GetAgent survey, that’s what agents themselves said sellers should look at.
A string of small reductions tells buyers you’re under pressure. One sensible change, backed by sold prices, does more. And mind the price bands: a home at £255,000 never shows up for buyers searching up to £250,000.
An early repayment charge can wipe out the benefit of holding out for a higher offer.
Work out what it’s costing you each month in council tax, energy, insurance and mortgage interest. Then compare that with what an extra month on the market is likely to gain you.
You can stay on the market, switch agents, go to auction, look at part exchange or take a cash sale. Each has trade-offs. A cash sale is faster and certain, but you’ll usually get less than full market value. Weigh up the real numbers, not just the headline price.
The comparison this report does not draw. This report counts every cost of an open-market sale and none of a cash sale. A fair comparison runs the same ledger on a cash offer, starting with the discount to market value, which is larger than any single cost in the tables above. A seller weighing a cash offer should compare it with the realistic open-market ledger above, including the cost of their own time and risk, rather than with the asking price. A cash sale is faster and certain, and usually below market value; the comparison only means something when both sides of it are complete.
More on the issues in this report: what happens during an estate agent valuation, what to do if your house isn’t selling after a price reduction, and options when your house isn’t selling.
This report is for information only and is not financial advice.
Method and sources
The worked example
Everything in the ledger is built on one example home, not an average of real sales. We used:
- An asking price of £300,000.
- A 3.5% gap between asking and agreed price, in line with Zoopla’s Q1 2026 figure.
- One 5% price cut in scenarios B and C. This is our assumption, not a published average. It’s a typical single reduction, but many sellers cut less and some cut more than once.
- The midpoint of each HomeOwners Alliance fee range, and an agent fee of 1.42% including VAT.
- About 214 days from listing to completion (64 days to find a buyer plus about 150 to complete), from Rightmove.
- For empty homes: average council tax per dwelling in England for 2026-27 (£1,868, MHCLG) and a typical energy bill under the Ofgem price cap from 1 October 2026. Insurance is not included.
- In scenario C, a £150,000 mortgage at 4.5%, with only the interest counted as a cost. Capital repayments aren’t a loss, so we left them out.
What this doesn’t cover
Holding costs only apply to homes that are empty. If you’re living in your home while you sell, you’d be paying those bills anyway. We haven’t included stamp duty on the onward purchase, mortgage exit fees, early repayment charges or capital gains tax, because they vary too much from seller to seller. Your numbers will differ from ours.
Our own data
The Bettermove figures come from the reason-for-sale field on enquiries to our website between January and August 2026. Sellers pick one reason from a list. That tells us why people contact a cash buyer, not why the wider market sells. Changes in where our enquiries come from can move these numbers too.
How figures are labelled
Where a figure is a measured average of real transactions, the text names the source and period. The GetAgent figures are a survey, self-reported by 162 agents. The ledger is a model, not a measurement, and the text says so wherever it appears. The report does not present one kind of evidence as another.
Sources
- Zoopla House Price Index and research on asking prices and price cuts, 2026; overpricing research via Property Industry Eye
- Rightmove data on time to sell, time to complete and share of homes finding a buyer
- Watkin Property Ventures analysis of property portal data on price reductions and fall-throughs, 2026, via PropertyWire
- GetAgent survey of 162 estate agents on over-valuation, via Estate Agent Today
- HomeOwners Alliance, costs of selling a home
- Open Property Data Association (OPDA), cost of failed transactions
- MHCLG, Council Tax levels set by local authorities in England 2026-27
- Ofgem energy price cap, from 1 October 2026
- Bettermove enquiry data, January to August 2026
At a glance
| Figure | Value | Source | Type |
|---|---|---|---|
| Gap between asking and agreed price | 3.5% | Zoopla, Q1 2026 | Measured average |
| Sold homes that needed a price cut first | 1 in 4 | Rightmove, 2026 | Measured share |
| Homes listed over three years that never sold | 44% | Zoopla | Measured share |
| Costs of sale on a £300,000 home | About 2% | HomeOwners Alliance | Published averages |
| Time from listing to completion | About 214 days | Rightmove, September 2026 | Measured average |
| Agreed sales that fall through | 1 in 4 | Watkin Property Ventures portal analysis | Measured share |
| Cost of a failed sale | About £2,830 and three months | OPDA | Published estimate |
| Daily cost of an empty home with a £150,000 mortgage | About £28 | Bettermove model (MHCLG, Ofgem) | Model |
| Returned by a well-priced, occupied sale | About 94p in the pound | Bettermove ledger | Model |
| Returned by a cut-price, empty-home sale | About 88p in the pound | Bettermove ledger | Model |
Take the full report with you
The complete Bettermove Seller Report as a PDF: every chart, table, source and method note, ready to save, print or share.
Download the report (PDF)Quoting or sharing these figures?
You’re welcome to quote any figure, table or chart from this report. Please credit Bettermove and link to this page, or to the section you’re quoting: every section has its own link.
You can also download the full report as a PDF.
For comment, the underlying numbers or high-resolution charts, email hello@bettermove.co.uk or call 0330 004 0050.
Want the real numbers for your home?
We’ll give you a firm cash offer within 24 hours, so you can set it against your own open-market ledger. Any condition, any postcode in England and Wales, and no fees.